Lunar farside gravity field
The first picture of the lunar farside was taken by unmanned Luna 3 of the Soviet Union in 1959. However, the details of the lunar gravity field on the farside were veiled for a long time. Tracking data of spacecraft are usually used to retrieve gravity field of a celestial body. Because the motion of any spacecraft is mainly governed by the gravity field of the central body, tracking the orbital motion of the spacecraft by using radio wave will conversely give us the information of the gravity field. However, the ground-based radio tracking is not possible when the spacecraft is on the farside because of the synchronous rotation of the Moon. This is the reason why the gravity field on the lunar farside had not been well known. In order to directly observe the lunar farside gravity field for the first time, the RSAT mission of SELENE made use of a small relay satellite inserted into an elliptical orbit which relays the Doppler tracking signal of the main satellite (Kaguya) when it is on the farside (Fig. 1). Figure 2 compares the gravity anomaly maps on the farside before (left) and after (right) SELENE. The gravity anomalies in concentric shape, which correspond to the shape of the impact basins, were clearly retrieved by the RSAT mission.
Satellite tracking by differential VLBI
SELENE had another small sub-satellite which is called VRAD satellite. Artificial radio sources called VRAD are on board both the relay and VRAD satellites. The precise orbit determination of the sub-satellites are performed using the differential VLBI method, receiving the signals transmitted from the radio sources by multiple ground stations (Fig. 3). We got better orbit consistency by combining the differential VLBI data with the conventional range and Doppler observations (Fig. 4). Multiple kinds of tracking data for multiple satellites in total resulted in a better estimation of the gravity field.
Inferring sub-surface structure
The surface and sub-surface topography are mainly responsible for the gravity anomaly. The gravity made by the surface topography can be calculated by the topography model obtained from the SELENE laser altimeter (LALT) data. The sub-surface topography (the shape of the crust-mantle boundary) can be inferred by correcting for the gravity effect caused by the surface topography. Shown in Fig. 5 is the map of crustal thickness so obtained. This map is regarded as one of the basic information about the Moon and being used for interpreting the mineral distribution.
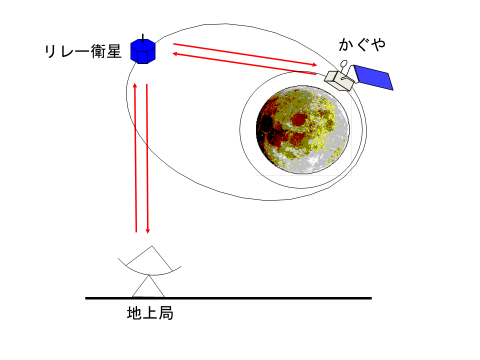
Figure 1
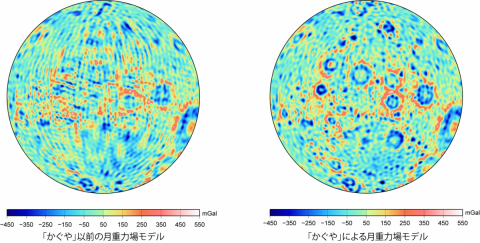
Figure 2
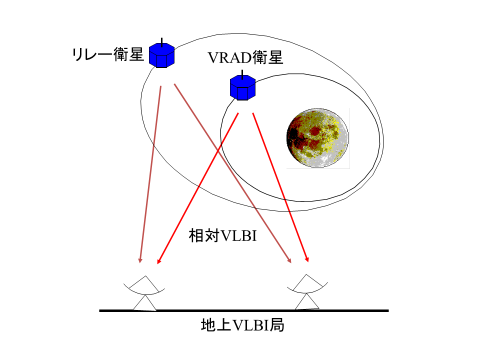
Figure 3
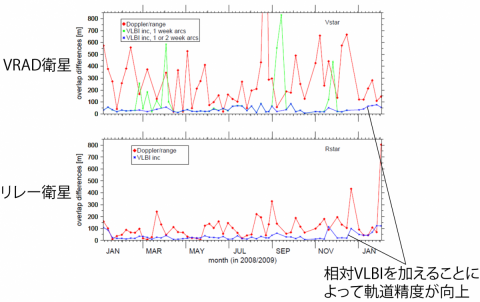
Figure 4
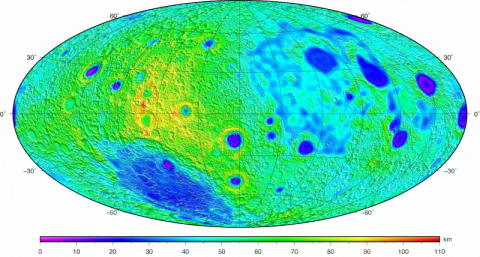
Figure 5